

Austin Housing Market 2025: Price Drops Surge as Inventory Climbs
Published | Posted by Dan Price
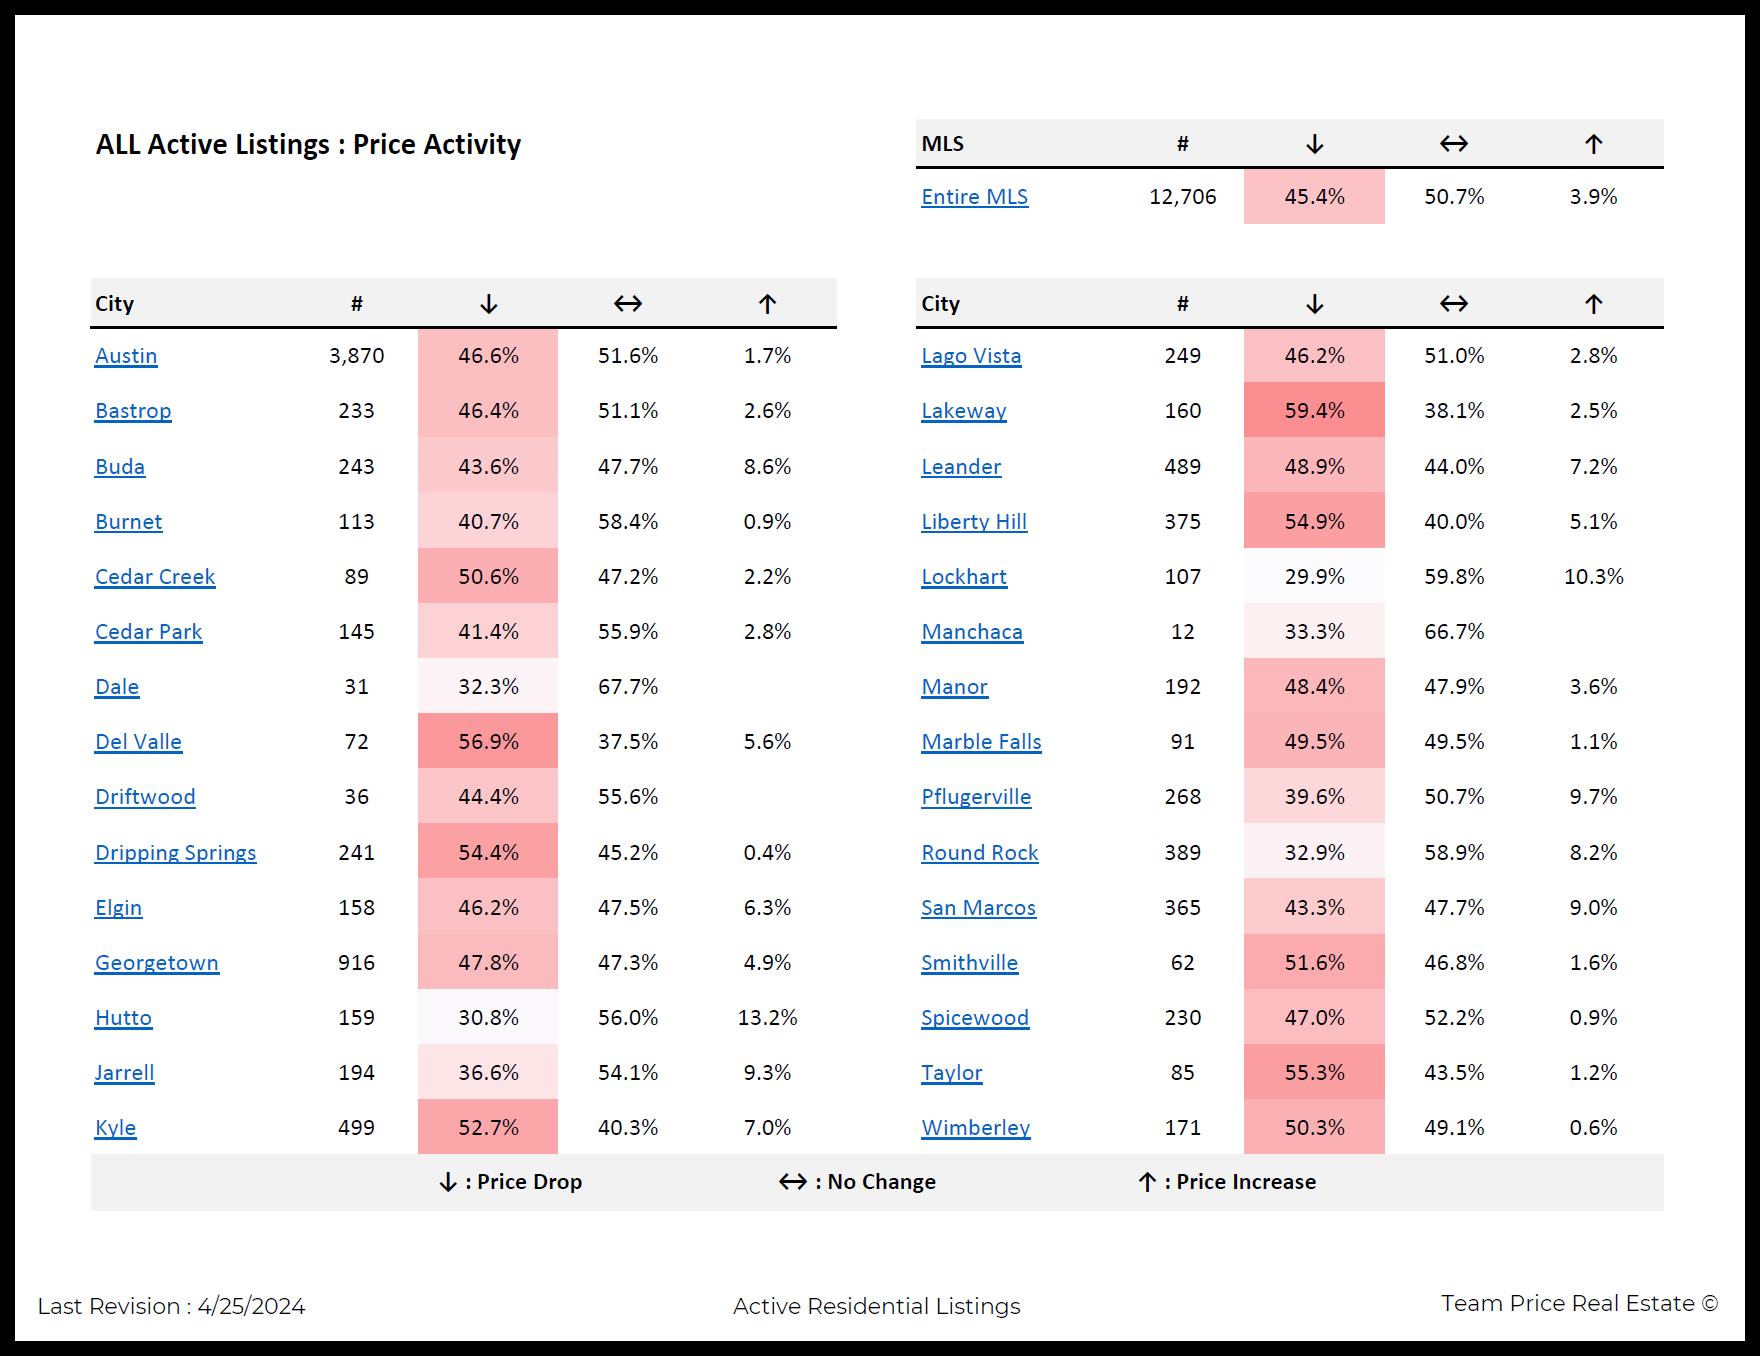
Austin Area Housing Market: Price Drops and Inventory Surge in April 2025
The Austin housing market is experiencing significant shifts in April 2025, with active residential listings and pricing trends reflecting a changing landscape for buyers and sellers. Across 30 cities in the Austin area, data from Team Price Real Estate reveals that active listings total 15,965, with 49.0% of these properties seeing price reductions. This marks an increase from last year’s figure of 45.4% of listings with price drops, indicating growing pressure on sellers to adjust their expectations. The market is also seeing a substantial rise in inventory, with active listings up 15.01% month over month and 22.4% year over year, contributing to a more competitive environment for sellers.
Inventory levels are climbing, with the months of inventory rising to 5.69 in 2025, a 25.4% increase from 4.54 in 2024. This buildup of available homes is putting downward pressure on prices, as the supply of homes outpaces demand. Pending sales, currently at 4,990, are down 2.3% year over year, further signaling a slowdown in buyer activity. The Activity Index, which measures market dynamism, has dropped from 28.1% in 2024 to 23.8% in 2025, a decline of 15.4%. This combination of rising inventory and declining pending sales suggests a market where buyers have more choices, and sellers face increased competition.
Among the 30 cities tracked, price reduction trends vary significantly. In Manor, 76.2% of the 246 active listings have seen price drops, the highest in the region. Kyle follows closely, with 57.8% of its 526 listings experiencing price reductions, as does Lago Vista, also at 57.8% of its 276 listings. Other cities with notable price drops include Lockhart (57.5% of 115 listings), Elgin (56.1% of 264 listings), and Wimberley (56.9% of 164 listings). In contrast, Spicewood stands out with the lowest rate of price reductions, at 37.5% of its 264 listings, suggesting relatively stable pricing in that market. Cedar Park (41.3% of 218 listings) and Driftwood (42.0% of 50 listings) also show lower-than-average price drop rates, indicating pockets of resilience in the region.
Price stability, where listings maintain their original asking price, is most common in Driftwood, where 58.0% of the 50 listings have seen no change, followed by Cedar Park at 57.8% of 218 listings. Smithville also shows strong price stability, with 61.3% of its 80 listings unchanged. However, cities like Kyle (36.9% of 526 listings) and Liberty Hill (35.5% of 440 listings) have fewer listings holding steady, reflecting greater pricing pressure in those areas. Price increases, while rare, are most prevalent in Manor, where 8.5% of listings have seen upward adjustments, followed by Jarrell (7.1% of 225 listings) and Liberty Hill (7.0% of 440 listings). These increases are outliers in a market largely characterized by price reductions or stability.
Austin itself, with the largest share of listings at 5,055, mirrors the regional trend, with 48.3% of properties experiencing price drops and 50.5% maintaining their original price. Only 1.2% of Austin’s listings have seen price increases, underscoring the broader trend of softening prices. Georgetown, with 1,175 listings, shows a slightly higher rate of price drops at 51.1%, while Round Rock (53.2% of 588 listings) and Leander (47.0% of 653 listings) also reflect the regional pattern of increasing inventory and price adjustments.
The data paints a clear picture of a market in transition. With active listings growing by 22.4% year over year and months of inventory rising to 5.69, sellers are facing a more crowded market. The decline in pending sales by 2.3% and the drop in the Activity Index by 15.4% further highlight a cooling demand. As 49.0% of listings across the region now carry reduced prices—up from 45.4% last year—sellers in cities like Manor, Kyle, and Lago Vista are adjusting to attract buyers in a market with more options. Meanwhile, areas like Spicewood and Cedar Park show relative price stability, offering insight into localized market dynamics. For buyers, the increased inventory and widespread price reductions present opportunities, while sellers must navigate a competitive landscape with strategic pricing.
FAQ Section
What is the current state of the Austin housing market in 2025?
In April 2025, the Austin housing market has 15,965 active residential listings, up 15.01% month over month and 22.4% year over year. Of these, 49.0% have seen price reductions, compared to 45.4% last year. Pending sales are down 2.3% year over year at 4,990, and the months of inventory have risen to 5.69 from 4.54 in 2024, a 25.4% increase, indicating a market with growing supply and softening demand.
Which Austin-area cities have the highest price reductions in 2025?
Manor has the highest rate of price reductions, with 76.2% of its 246 active listings seeing price drops. Kyle and Lago Vista both have 57.8% of their listings (526 and 276, respectively) with reduced prices, followed by Lockhart (57.5% of 115 listings) and Wimberley (56.9% of 164 listings).
How does Austin’s housing inventory compare to last year?
In 2025, the Austin area’s months of inventory stand at 5.69, a 25.4% increase from 4.54 in 2024. Active listings have grown by 22.4% year over year, totaling 15,965, reflecting a significant rise in available homes and increased competition for sellers.
Request Info
Have a question about this article or want to learn more?
